This article is general health education, not medical advice. It cannot interpret your specific result. See our Medical Disclaimer.
Why Your Lab's Reference Range Differs From Charts Online
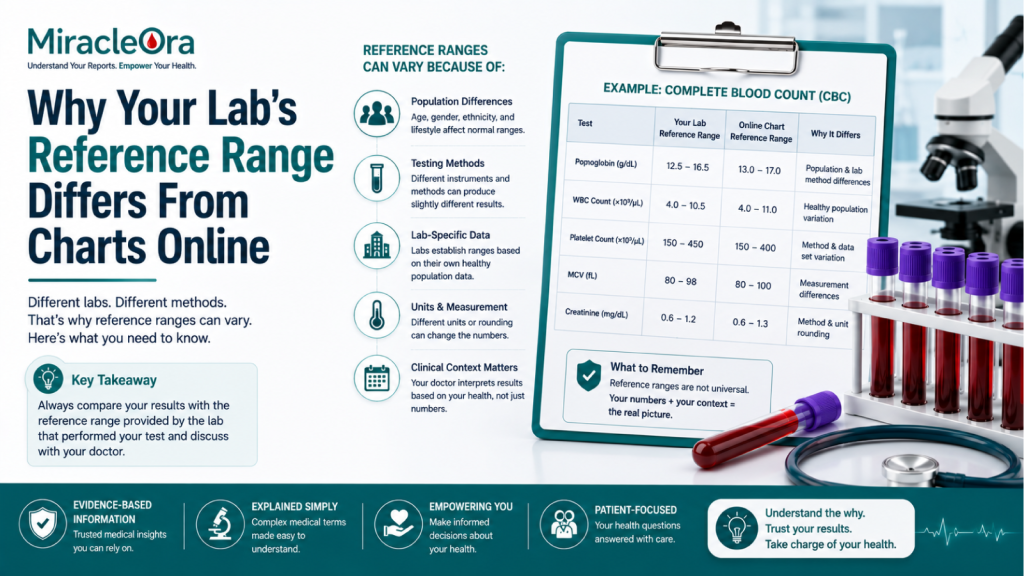
Short answer: both can be right. A reference range is a property of the laboratory that produced it, not a property of your body. Different laboratories use different analyzers, different reagents, different calibration and different reference populations, so their ranges genuinely differ. The range that matters for your result is the one printed on your own report, because that is the range your number was actually compared against.
This is the single most common reason a person finishes reading a health article more worried than when they started. They compare a value on their report to a chart written for a different laboratory, on a different continent, and reach a conclusion their own lab never drew.
What a reference range actually is
A reference range is not a boundary between healthy and unhealthy. It is a statistical interval. A laboratory measures a test in a group of apparently healthy people, called the reference population, and then publishes the band that covers the central 95 percent of those results.
Two consequences follow, and both are built into the arithmetic rather than being flaws:
- About one healthy person in twenty falls outside the range for any given test, with nothing wrong. That is what a 95 percent interval means.
- A different reference population produces a different band. Same test, same method, different group of healthy volunteers, slightly different numbers.
Testing.com describes the same convention, and Cleveland Clinic notes on its complete blood count page that normal ranges vary depending on the laboratory performing the test and on factors including your age. The NIH's StatPearls chapter on the complete blood count with differential repeats throughout that ranges are lab-specific in practice.
Six reasons two labs print different numbers
| Mechanism | What it changes on your report |
|---|---|
| Different analyzers | Hematology instruments from different manufacturers count and size cells by different physical methods. Systematic small differences between platforms are expected, not errors. |
| Different reagents and calibration | The same machine run with a different reagent lot, or recalibrated, can shift results slightly. Laboratories run daily quality control precisely because of this. |
| A different reference population | A lab that established its range on its own local donors will differ from one that verified the manufacturer's range on a different group. Age, sex and general health of that group all feed in. |
| Different partitioning | Some labs publish one adult range; others publish separate bands for men, women, pregnancy and several pediatric age brackets. Whether your report even has a row for your situation is a lab decision. |
| Different units | The same value can appear as 150,000/mcL or 150 x 10⁹/L. A reader comparing across unit systems can conclude a hundredfold difference exists where none does. |
| Sample handling | Time to analysis, storage and, occasionally, how the sample was collected all influence certain measurements. |
None of these makes one laboratory right and another wrong. They make the pairing of your number with that lab's band the only comparison that carries meaning.
Ranges that are supposed to differ
Some of the variation you notice between charts is not lab-to-lab noise at all. It is real biology that a good chart partitions and a poor chart flattens:
- Sex. Hemoglobin, hematocrit and red cell counts run higher in adult men than in adult women in widely published adult ranges.
- Age. Children's blood counts differ substantially from adults', and they change with age rather than sitting at one pediatric band. A child's result flagged against an adult chart is a classic false alarm.
- Pregnancy. Plasma volume rises during pregnancy, which dilutes the red cell measurements. Hemoglobin values that would be flagged outside pregnancy can be expected within it, which is why pregnancy has its own ranges.
- Altitude. Populations living at high altitude carry higher hemoglobin and hematocrit as a normal adaptation.
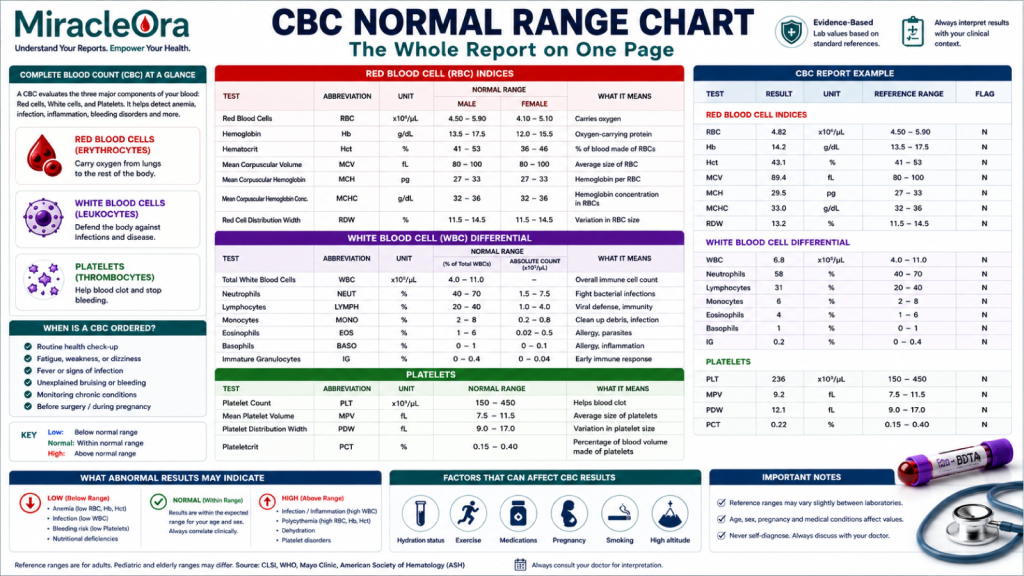
If the chart you found online does not say which of these it applies to, it is not a chart you can compare yourself to. Our own complete reference-range table states its sources and its limits for exactly this reason.
Why a narrower range found online is not a stricter, better range
You will find pages arguing that laboratory ranges are too wide and offering a narrower "optimal" band instead, often attached to a product. Treat that framing carefully.
A narrower band does not contain more information. It simply relabels more people as abnormal. Moving the edges of an interval without a clinical reason manufactures findings that then need explaining, and the explaining tends to be sold alongside the chart. The honest position is duller: your laboratory's range is the one your result was judged against, and the meaning of a value near either edge is a clinical question rather than a charting question.
What this means when you switch labs or repeat a test
Three practical consequences, and they cover most of the confusion:
- A number that changed between labs may not reflect a change in you. If you tested at one laboratory and repeated at another, part of any difference belongs to the platforms. Doctors generally prefer to track a trend within one laboratory for this reason.
- A flag that appeared or vanished may be the band moving, not the value. A hemoglobin unchanged between two tests can be flagged at one lab and unflagged at another if their lower limits differ.
- The trend still beats the snapshot. Even across labs, the direction of travel over several results usually tells a doctor more than any single number. We walk through what a flag does and does not signal in what an H or L flag means, and why an out-of-range value in a person who feels well is so often unremarkable in blood test abnormal but you feel fine.
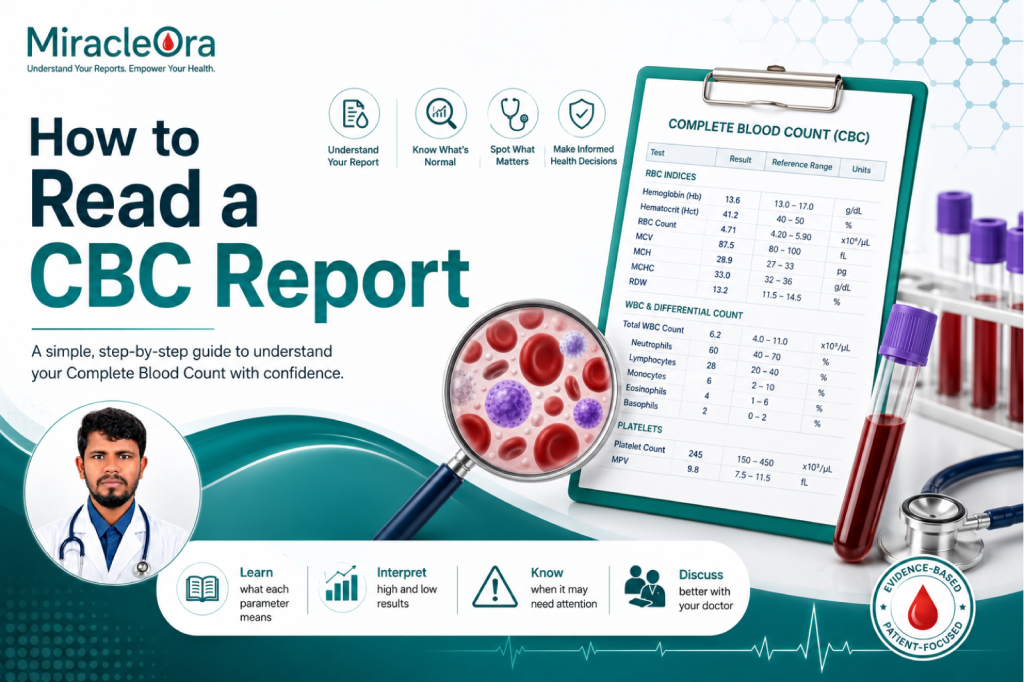
If you are trying to make sense of a whole report rather than one line, the plain-language walkthrough in how to read your CBC report is the place to start.
When the difference is worth raising with your doctor
Bring it up rather than resolving it yourself if:
- Your result sits outside your own report's range, whatever any online chart says.
- You are comparing tests from two different laboratories and trying to judge whether something changed.
- Your report has no range printed for your age, sex or pregnancy status, so the comparison band may not fit you.
- You have been told to monitor a value over time and want to know whether to keep using the same laboratory.
- You have symptoms. Symptoms plus a number is a clinical conversation; a number alone is not.
Seek urgent care for severe symptoms such as chest pain, difficulty breathing, confusion, fainting or uncontrolled bleeding, regardless of what any range says.
Frequently asked questions
Which range should I trust, my report's or an online chart?
Your report's. That is the range your laboratory used to decide whether to flag your value, and it reflects that lab's instruments, methods and reference population. An online chart was built for someone else's laboratory.
Does a different range mean one of the labs made a mistake?
No. Differences between analyzers, reagents, calibration and reference populations are expected and are the reason each laboratory establishes or verifies its own ranges.
My old report and my new one have different normal ranges. Why?
The laboratory may have changed instruments, reagents or the population its range is based on, or you may have been tested at a different lab. It can also reflect partitioning, for example moving from a pediatric band to an adult one.
Are reference ranges the same worldwide?
No. They vary between laboratories and countries, and some are genuinely population-dependent. Values such as hemoglobin also vary with altitude as a normal adaptation.
Why does the same number appear so differently on two reports?
Often units. Platelet counts, for instance, are commonly reported both as cells per microliter and as x 10⁹ per liter. Check the unit column before concluding anything changed.
If ranges are this variable, are they useful at all?
Yes. Within one laboratory, over time, they are a consistent yardstick, which is what a doctor actually needs to spot a trend. They are simply not a universal verdict you can apply across sources.
Medical disclaimer: This article is provided by MiracleOra for general educational purposes only. It is not medical advice, diagnosis or treatment, and it does not interpret any individual person's results. Reference ranges vary by laboratory, age, sex and testing method. Always compare your results to the range printed on your own report and discuss what they mean with a qualified healthcare professional who knows your medical history. If you have severe or worsening symptoms, seek urgent medical care. See our full Medical Disclaimer.