RDW is one of the lines people notice only when it is flagged, because nobody explains it and the name gives nothing away.
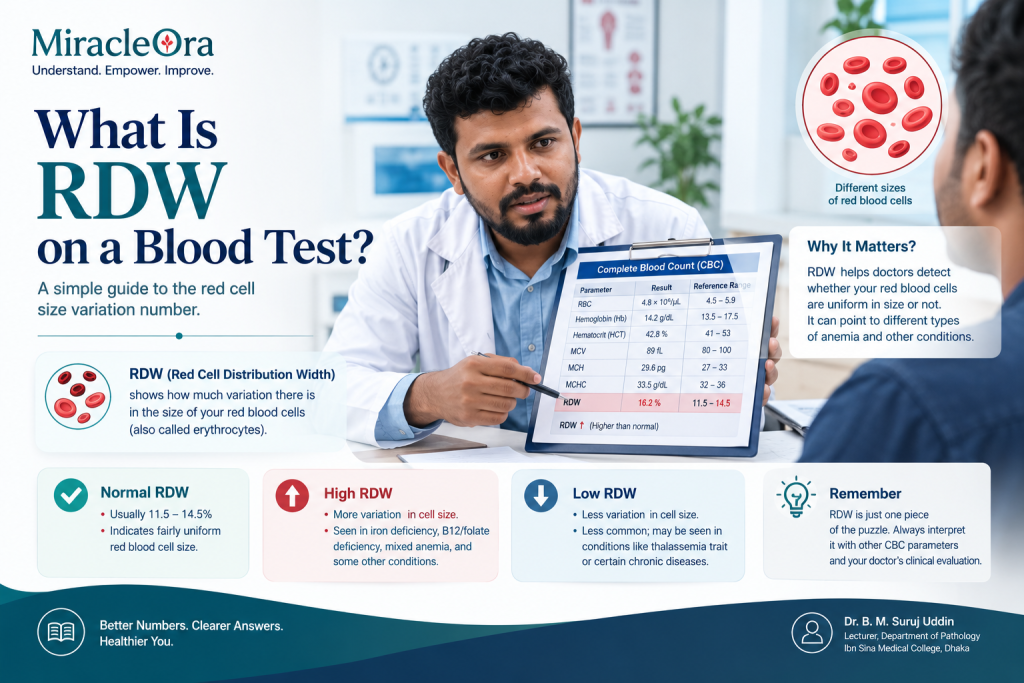
It stands for red cell distribution width, and here is the plain version. Every other red cell measurement on your report describes an average. RDW describes the spread around that average.
MedlinePlus, in its Medical Test page "RDW (Red Cell Distribution Width)" (last updated 15 October 2024), puts it this way: "A red cell distribution width (RDW) test measures how much the volume and size of your red blood cells (erythrocytes) varies."
Why a spread is worth measuring at all
Consider two people whose average red cell size is identical.
In the first, every cell is close to that average. In the second, half the cells are small and half are large, and they average out to the same figure. The average line on the report is the same for both. The population inside is completely different.
RDW is what tells those two apart, and that is its entire job.
MedlinePlus states that the test helps clinicians "diagnose or determine what's causing anemia, a condition in which your body does not make enough red blood cells," and notes that it is frequently part of a complete blood count. So it is not usually ordered on its own. It arrives with everything else, and if you have a CBC report you have an RDW on it whether you asked for one or not. The CBC abbreviations, decoded covers the rest of the shorthand on the same page.
How the number is produced, and what it is not
StatPearls, in the chapter "Normal and Abnormal Complete Blood Count With Differential" by El Brihi and Pathak (last update 8 June 2024), describes the calculation directly: "The value is calculated as the standard deviation or the coefficient of variation of the MCV distribution curve."
Two consequences follow from that sentence and they are worth stating plainly.
RDW is derived, not measured. The analyzer measures the cells and computes the spread. It is arithmetic performed on the same data that produced MCV, which is why the two are read together rather than separately.
It is usually a percentage. A higher percentage means more variation in size. It says nothing about whether the cells are large or small, only about how much they differ from each other.
On the reference interval, StatPearls states the normal range is "approximately 11.5% to 15%" and that this "varies between laboratories." That last clause is the one to hold on to. A value that is flagged high on one laboratory's report is not necessarily flagged on another's, and this site has an entire page on why that happens: why your lab's reference range is different.
What a high RDW means, per the sources
MedlinePlus states that an elevated result indicates "your red blood cells vary in size more than what is considered normal," and lists liver disease, heart disease, diabetes, kidney disease and certain cancers among the conditions it may signal.
Notice what that list is and is not. It is a list of conditions in which a raised RDW has been observed. It is not a list of things you have. A wide spread in cell size is a general finding, produced by many different processes, and on its own it points in no particular direction.
There is a mechanical reason the finding is so non-specific. If the bone marrow starts producing cells of a different size than the ones already circulating, both populations are in the blood at once for a period, and the spread widens. That happens in a great many situations, which is why the same number can appear in unrelated conditions.
Why it is read with MCV and not alone
This is the part that makes RDW useful rather than merely present.
StatPearls states that RDW "is useful in assessing anemia to help further delineate etiology," and describes the indices as working together with MCV to classify anemias and identify underlying causes.
The pairing works because the two answer different questions. MCV, which MedlinePlus's "RBC indices" page (review/update 27 February 2026) defines as "Average red blood cell size," gives you the average. RDW gives you the spread. Four combinations are possible, and each is a different starting point for a clinician working out what is going on.
This site does not print an interpretation grid mapping those four combinations onto named conditions, and that is a deliberate line rather than a gap. Such a grid is a diagnostic instrument, and a reader with two numbers and a grid arrives at a name for their condition without any of the history, examination or additional testing that produced it. What the pairing means for one specific person is a clinician's question. What the pairing is for is above, attributed.
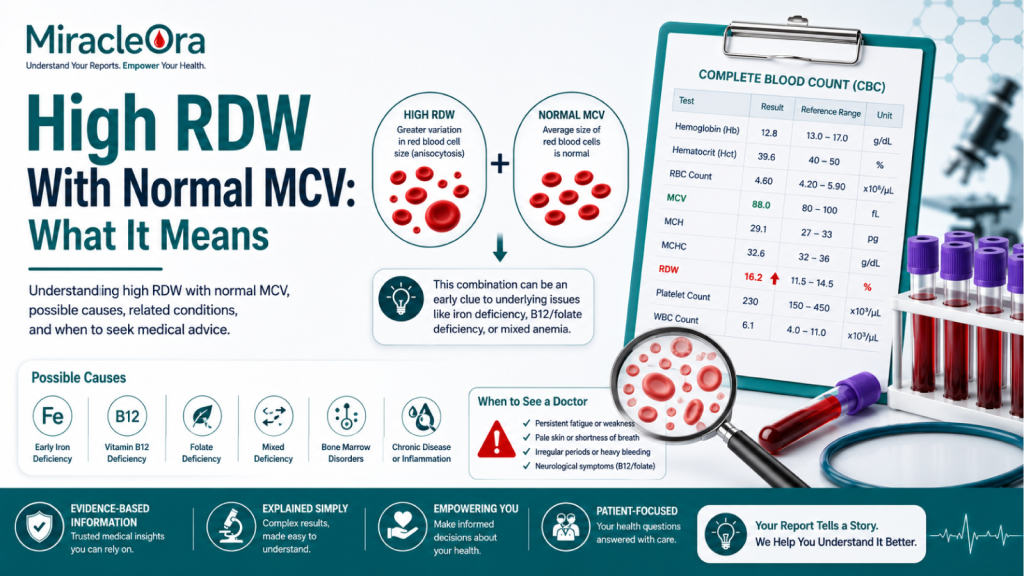
The one combination this site does cover in detail, because it is the most searched and the most anxiety-producing, is a high RDW with a normal MCV. The types of anemia covers the broader classification these indices feed into.
A normal RDW is not an all-clear
MedlinePlus makes a point on this that is easy to skip past and worth quoting directly. On a normal result, the page says your red blood cells "are within the reference range," and then adds the caveat: "Even if your RDW results are normal, your red blood cells may still be larger or smaller than usual."
That is exactly the two-people scenario from the top of this page, running the other way. A uniform population of cells that are all the same wrong size produces a narrow spread and a normal RDW. The variation measurement is normal because there is little variation, not because there is no problem.
So RDW is not a screening test and a normal value rules nothing out. It is one line, read with the others.
What to do with the flag
MedlinePlus's own framing is the useful one: providers "will usually look at your RDW results along with the results of other blood tests," which the page presents as meaning results require interpretation in a broader clinical context rather than standing alone.
Three practical points:
A flag is not a diagnosis. Reference intervals are constructed so that a proportion of entirely healthy people fall outside them, which is why an abnormal blood test when you feel fine is so common a situation and so rarely explained.
Bring the whole report, not the flagged line. RDW in isolation is close to meaningless. RDW with the hemoglobin, the MCV and the rest of the panel is a starting point. How to read a CBC report covers finding your way around the page.
Ask, rather than decode. The question worth asking is "what does this look like alongside my other results", and the person to ask is whoever ordered the test.
The short version
- RDW measures how much your red cells vary in size. Every other red cell figure is an average; this is the spread.
- StatPearls (8 June 2024) describes it as calculated from the MCV distribution curve, with a normal range of approximately 11.5% to 15% that varies between laboratories.
- MedlinePlus (15 October 2024) lists several unrelated conditions in which it can be raised. It is a non-specific finding.
- It is read together with MCV, because average and spread answer different questions.
- A normal RDW does not mean the cells are normal, as MedlinePlus states directly.
- The interpretation belongs to the clinician who has the whole report.